A common worry among developers adopting containers is that debugging will become harder. In practice, docker compose makes debugging more predictable, because the service topology and declared dependencies can be reproduced more consistently.
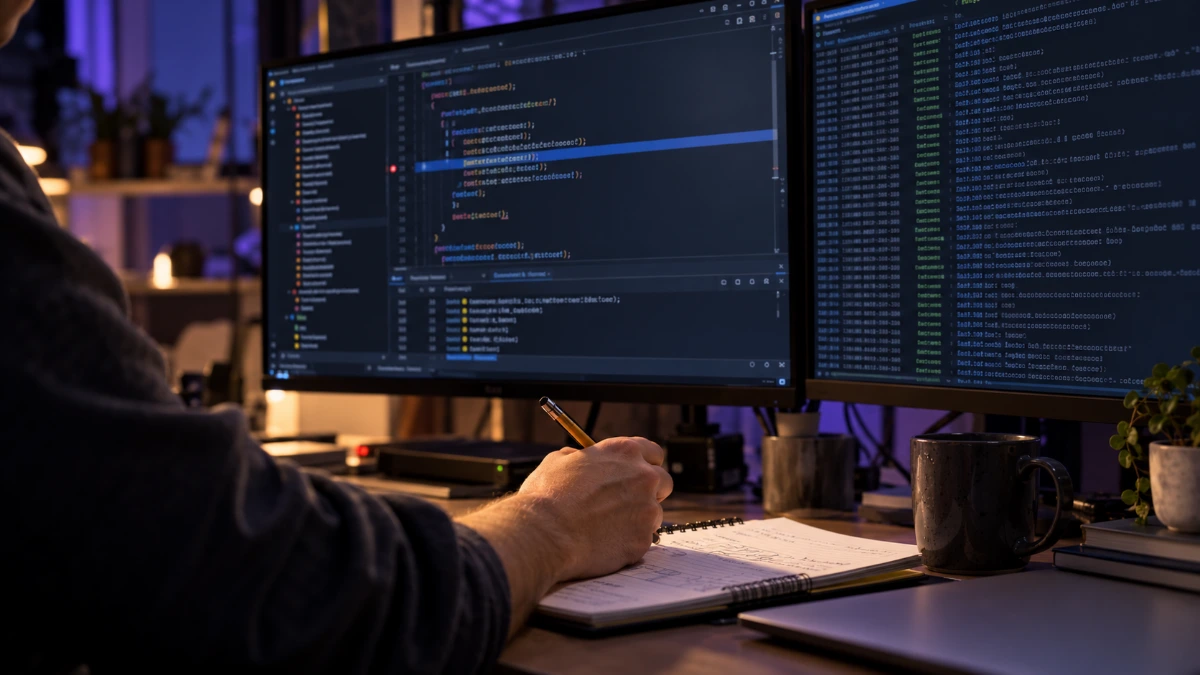
Attaching an IDE debugger
Most language runtimes expose a debugging protocol over a network port. The strategy is identical across languages: start the process in debug mode, publish the port and point your IDE at it.
- Node.js: start with
node --inspect=0.0.0.0:9229and publish9229. - Python: use
debugpylistening on5678. - .NET: Visual Studio and VS Code can attach to a running container using the container tools extension, which installs the remote debugger automatically.
- Java: enable JDWP on port
5005.
services:
  api:
    command: node --inspect=0.0.0.0:9229 server.js
    ports:
      - "127.0.0.1:9229:9229"
Keeping debug settings in an explicitly selected override file reduces accidental exposure. Ensure production commands do not load this file, and inspect the resolved configuration before deployment. Start the stack with docker compose -f compose.yaml -f compose.debug.yaml up.
Making the most of logs
docker compose logs aggregates output from every service, prefixing each line with its source. Useful flags include -f to follow, --since 10m to limit the window and --timestamps to correlate events across services.
Interactive inspection
docker compose exec api sh opens a shell inside a running container, allowing you to inspect files, test network connectivity to other services and check environment variables. If the container keeps crashing, docker compose run --rm --entrypoint sh api starts a fresh one with a shell instead of the usual command.
Inspecting the network
Connectivity issues between services are often caused by a mistaken host name. From within a container, try resolving the target with getent hosts db. If it fails, confirm both services share a network in the Compose file.
Source code synchronisation
Breakpoints are only useful if the running code matches your editor. Use bind mounts or watch mode so that changes are reflected immediately, and ensure source maps are enabled for compiled languages.
Make the diagnostic boundary explicit
Debugging access should be intentional and temporary. Bind host-side debugger ports to the loopback interface where possible, keep diagnostic overrides separate from production configuration and remove capabilities that the application does not require.
Capture the service name, timestamp and request identifier alongside each observation. Container restarts can obscure the original sequence of events, so preserve relevant logs before rebuilding.
Begin with a reproducible failure
Effective docker compose debugging starts with a specific observation. Record the request, command or user action that fails and the result you expected. Note whether the problem happens on every run, only after startup or only after a file changes. Then identify the service that first reports a failure. A web container may show a database connection error even though the underlying problem is an unhealthy database. Following the request through the service chain keeps the investigation focused on the earliest meaningful failure rather than the loudest downstream message.
Keep the environment stable while collecting evidence. Save the relevant log output, selected Compose files and nonsecret configuration details before restarting anything. A restart can remove the timing pattern or erase the process state you needed to inspect. If you can reproduce the issue with one harmless request, use that same request after each change. This gives you a consistent comparison.
Separate build failures from runtime failures
An image build failure happens before the application container can run. Inspect the failing build instruction, dependency download or build context first. A runtime failure occurs after an image exists and a container process starts. Its evidence usually comes from the process logs, exit status and service configuration. The two paths can overlap, but they require different checks.
Confirm where your source code comes from. If the image copies source during the build, a changed file needs a new image before a replacement container can use it. If a bind mount supplies source at runtime, inspect the mounted path and the application's reload behaviour. A mount may also hide files that were installed into the image. Compare the file location the process reads with the path you are editing.
Debug communication one boundary at a time
Start with the connection from the browser to the published host port. Then check the connection from the application container to the dependency's service name and internal port. These are different network paths. A database reachable from a desktop client is not automatically configured correctly for another container, and a service reachable internally may have no published host port at all. Write down the source, destination and port for the failing connection. That small map often reveals a localhost assumption, a wrong port or an isolated network immediately.
If a diagnostic tool is missing from a minimal image, do not assume the network itself is broken. Use an approved diagnostic approach suited to the environment, or rely on the application's own connection test. Avoid installing random packages into a valuable running container just to make it resemble your workstation. Such changes are temporary and make the environment harder to reproduce. Prefer a repeatable diagnostic task and record exactly what it tested. Verify credentials and readiness separately from basic connectivity, since a reachable database can still reject authentication or lack the expected schema.
Keep debugger access scoped to development
An interactive debugger can inspect memory, execute code and pause request handling. Treat its listener as a development interface with deliberate access boundaries. Bind the host port to loopback when only your workstation needs it, and keep the debugger configuration out of deployment overrides. Make sure your IDE maps local source paths to container paths correctly. If those paths differ, the application may run normally while breakpoints never bind. Confirm the executed file and runtime before changing unrelated Compose settings.
Pausing a process can also affect health checks and dependent services. A health check may time out while you inspect a breakpoint, and another service may report connection failures caused by the pause. Recognise those as consequences of the debugging session rather than new application defects. Use a dedicated development profile or override when a debugger needs different startup arguments. This makes the special behaviour visible and reversible. After investigating, return to the normal command and confirm that the original request works without relying on the debugger being attached.
Turn a successful diagnosis into a repeatable fix
Once you find the cause, make the correction in the repository or supported configuration source. A manual change inside a container can prove a hypothesis, but it will disappear when the container is recreated. Rebuild or recreate the service using the corrected project files and run the same failing request again. Check nearby behaviour that depends on the change, such as database startup or file watching. This closes the gap between understanding a problem and supplying a fix that another developer can reproduce.
Keep a short record of the symptom, cause and verification command when the failure is likely to recur. Include useful nonsecret log lines and explain why the selected check distinguishes the problem from similar failures. Avoid retaining full environment dumps or private application data. If the issue involved a missing dependency or an undeclared migration, update the setup instructions so that a clean checkout does not repeat it. The best debugging outcome improves both the immediate application and the reliability of the workflow used to run it.
Frequently asked questions
Why are my breakpoints not being hit?
Check that the process started with debugger support, that the IDE reaches the intended port and that local paths map to the files executed inside the container. Also confirm that a stale image or a bind mount is not supplying different source code.
Should I restart every service when one fails?
Begin with the affected service and its dependencies. Restarting everything can hide the original sequence and disrupt services that were working. Save evidence first, then use the narrowest change that tests your current explanation of the failure.
Why do logs show connection errors only at startup?
The dependency may be running before it is ready. Check its health and initialisation time, and review the application's retry behaviour. A readiness dependency can help at startup, while retries remain useful for interruptions after the project is running.
Can I fix a container by editing files inside it?
You can use an interactive change to test a theory, but place the lasting fix in the source, image build or Compose configuration. Recreate the container afterward and repeat the failing action to verify that the correction survives replacement.
Conclusion
Docker compose debugging becomes manageable when you follow evidence across one boundary at a time. Reproduce the failure, distinguish build and runtime problems, inspect the relevant logs and verify the exact files and connections involved. Keep debugger access limited to development and move successful corrections into repeatable project configuration. Finish by running the original failing action against a recreated service so that the result proves the fix will survive the next startup.